| Visualize BNGL | BNGL sandbox | BNGL overview | Rules Railroad Concept | Visualizing conventions | Examples | About |
A syntax diagram is a graphical representation of a formal grammar that
visually depicts the structure of a programming language or data format.
Each diagram illustrates the permissible sequences of symbols in a language,
where nodes represent non-terminal or terminal symbols, and arrows or paths indicate the flow of valid constructions.
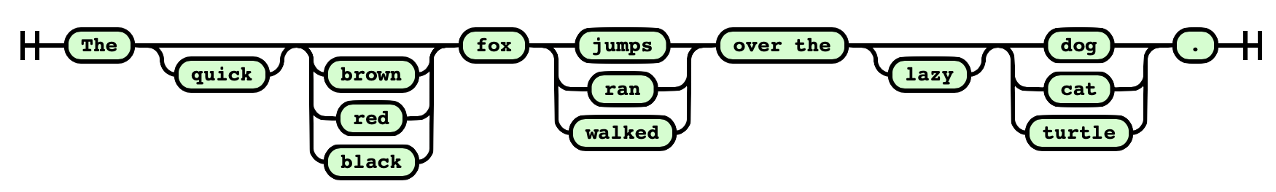
Syntax diagram below defines a language of all sentences of the form
"The {quick, —} {—, brown, red, black} fox {jumps, ran, walked} over the {—, lazy} {dog, cat, turtle}."
Here, each bracketed group offers choices, and “—” means the element can be omitted.
This gives: 2 × 4 × 3 × 2 × 3 = 144 possible sentences, such as: "The quick fox walked over the lazy cat."
or "The brown fox ran over the dog."
Rule-based languages such as BNGL (BioNetGen Language) consists of symbolic sentences describing molecules, species, observables,
reaction rules, and other parts of BNGL file. The structure of input file follows rules of
context-free grammar that
is a set of production rules that describe all possible strings in BNGL.
Example of the grammar
for BNGL in Extended Backus-Naur Form
(EBNF) is shown below.
It is a simplified form of the full
BNGL grammar
described in Harris et al., 2016.
BioNetGen 2.2: advances in rule-based modeling,
with some BNGL features like compartments and matching omitted.
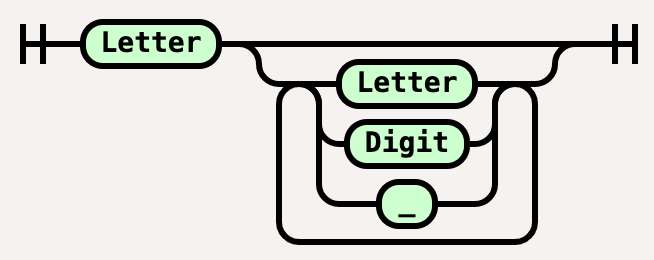
Name = Letter, [{Letter|Digit|"_"}];
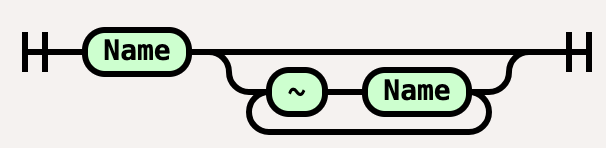
State = “~",Name;
Site = Name, [{"~",State}];
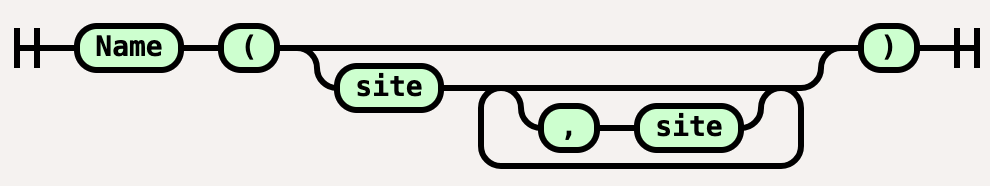
Molecule = Name, ["(",[Site,[{",",Site}]],")"];
This formal description is difficult to follow, so syntax diagrams
(also called railroad diagrams) were introduced to visualize this grammar.
The name declaration is
The site description is
The molecule description would be
Note the definition of the formal grammar - is a set of production rules that describe all possible strings in BNGL. Using this approach, we extended the railroad diagrams to visuallydescribe specific elements of rule-based description that can be combined into all possible strings in BNGL - essentially giving the full description of reaction networks generated by BioNetGen.